What should a dealership dashboard show?
Leadership needs to see how an outlet is performing and where to intervene. Sales volume alone cannot answer whether finance opportunities are being captured, commissions are being collected, or ageing inventory needs attention. The useful dashboard brings these questions together without hiding their definitions.
For a group operating several branches, consistency matters as much as coverage. A “sale” counted at booking in one branch and delivery in another produces a misleading comparison. Agree the event and date used before ranking outlets.
A practical dashboard scorecard
| Area | Leadership question | Context to retain |
|---|---|---|
| Sales | How many vehicles reached the chosen sales stage? | Period, branch, cancellations, target definition |
| Finance | What share of financed vehicles used in-house finance? | In-house, outhouse, cash, unknown counts |
| Commission | What is expected and what has been received? | Eligibility, adjustments, timing |
| Receivables | Which balances need follow-up? | Due-date rule and owner |
| Inventory | Which units have aged without action? | Ageing start date and valuation basis |
| People | Where does a team need support? | Assignment, workload, comparable scope |
Do not create a single composite score before understanding these components. A high-volume outlet can still have unresolved balances or a growing stock problem.
How does DealerPulse organize the view?
GrepEye DealerPulse gives dealership leaders an iOS and Android view across sales, finance, receivables, inventory, people, and operations. It supports branch and group views, drilldowns, period filtering, and the Indian April–March financial-year context.
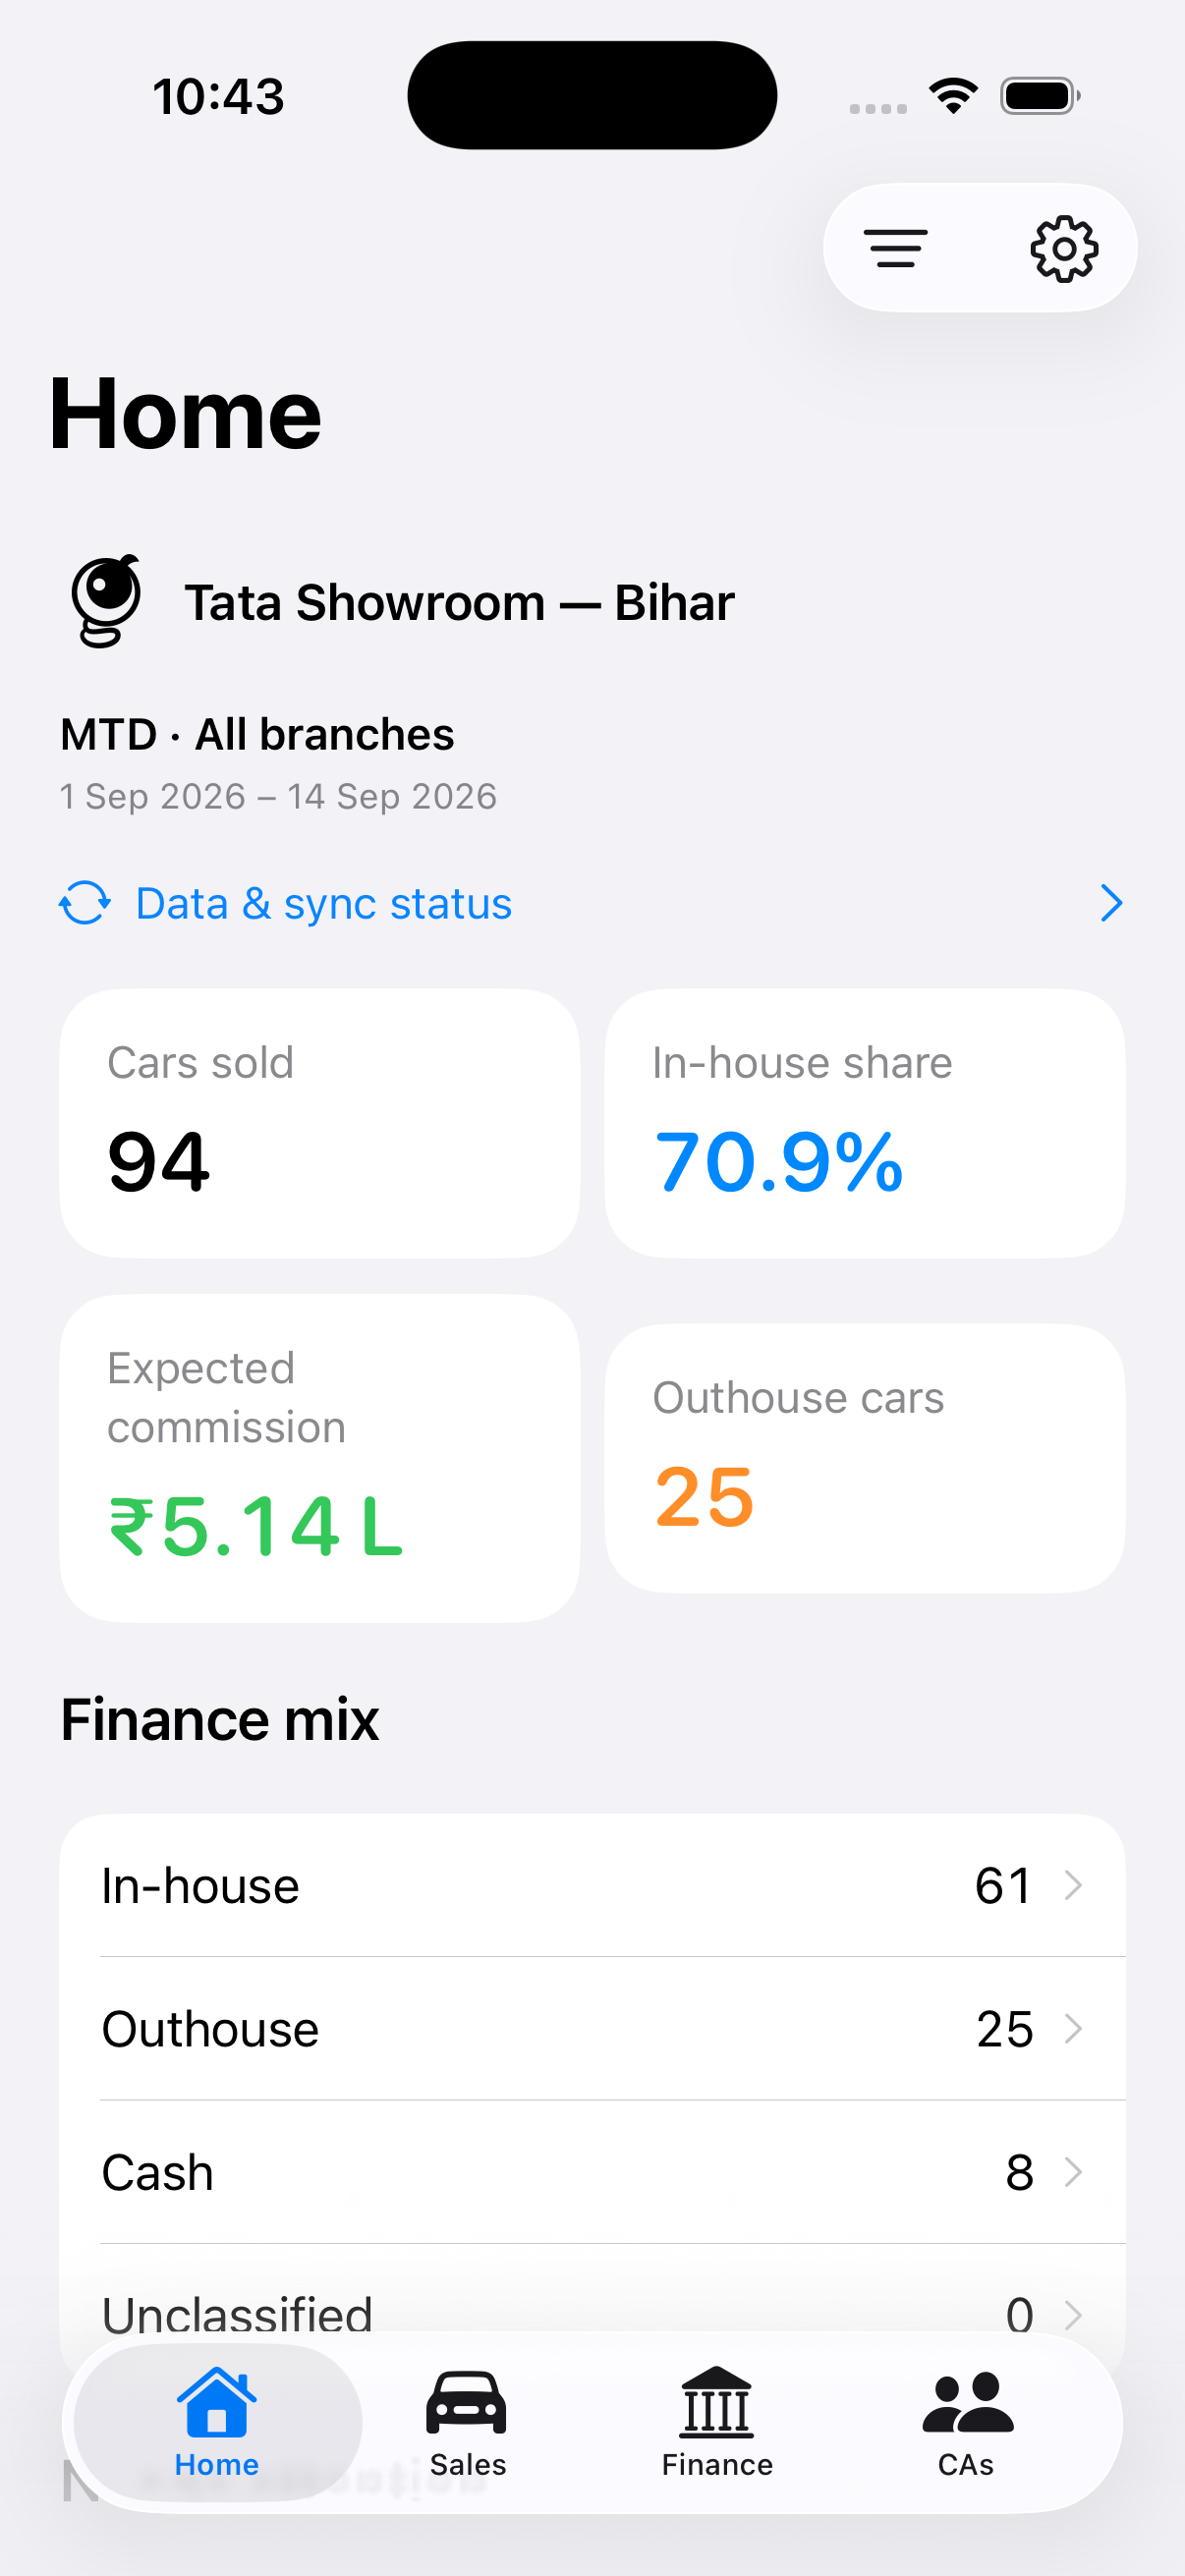
The supplied product screenshot shows the interface. Its displayed figures should not be treated as a benchmark, a guaranteed outcome, or a live report for another dealership.
A finance metric that needs its denominator
In the supplied finance example, 61 vehicles use in-house finance and 25 use outhouse finance. There are also eight cash vehicles and zero unknown classifications. In-house finance penetration among financed vehicles is 61 ÷ (61 + 25), or approximately 70.9%. Dividing by all 94 vehicles instead answers a different question.
Use the finance penetration guide and interactive calculator to check the distinction. Preserve raw counts alongside percentages so a small branch does not appear more stable than it is.
How should a group evaluate the dashboard?
Choose one period and reconcile a small number of vehicles or transactions from source to dashboard. Compare branch totals with the group view. Check an adjustment and a classification change. Confirm data freshness, permissions, and the required source connections with the implementation team.
DealerPulse uses a monthly subscription; ask for the scope and commercial terms for your group. Do not assume it replaces every DMS function. The DealerPulse and DMS comparison explains the distinction, while the branch scorecard guide provides a review structure.