What is the formula?
For the definition used in this guide:
In-house finance penetration = in-house financed vehicles ÷ (in-house + outhouse financed vehicles) × 100.
Write the definition beside the number. Some teams use “finance penetration” for a share of all sales instead. Both can be useful, but they answer different questions and must not be compared under the same label.
A worked example from the supplied DealerPulse screen
| Classification | Vehicles |
|---|---|
| In-house finance | 61 |
| Outhouse finance | 25 |
| Cash | 8 |
| Unknown | 0 |
| All vehicles | 94 |
There are 86 financed vehicles. In-house penetration among financed vehicles is 61 ÷ 86 × 100 = 70.9% when rounded to one decimal place.
In-house share of all vehicles is 61 ÷ 94 × 100 = 64.9%. Total finance share of all vehicles is 86 ÷ 94 × 100 = 91.5%. These results differ because their denominators differ, not because one calculation is necessarily wrong.
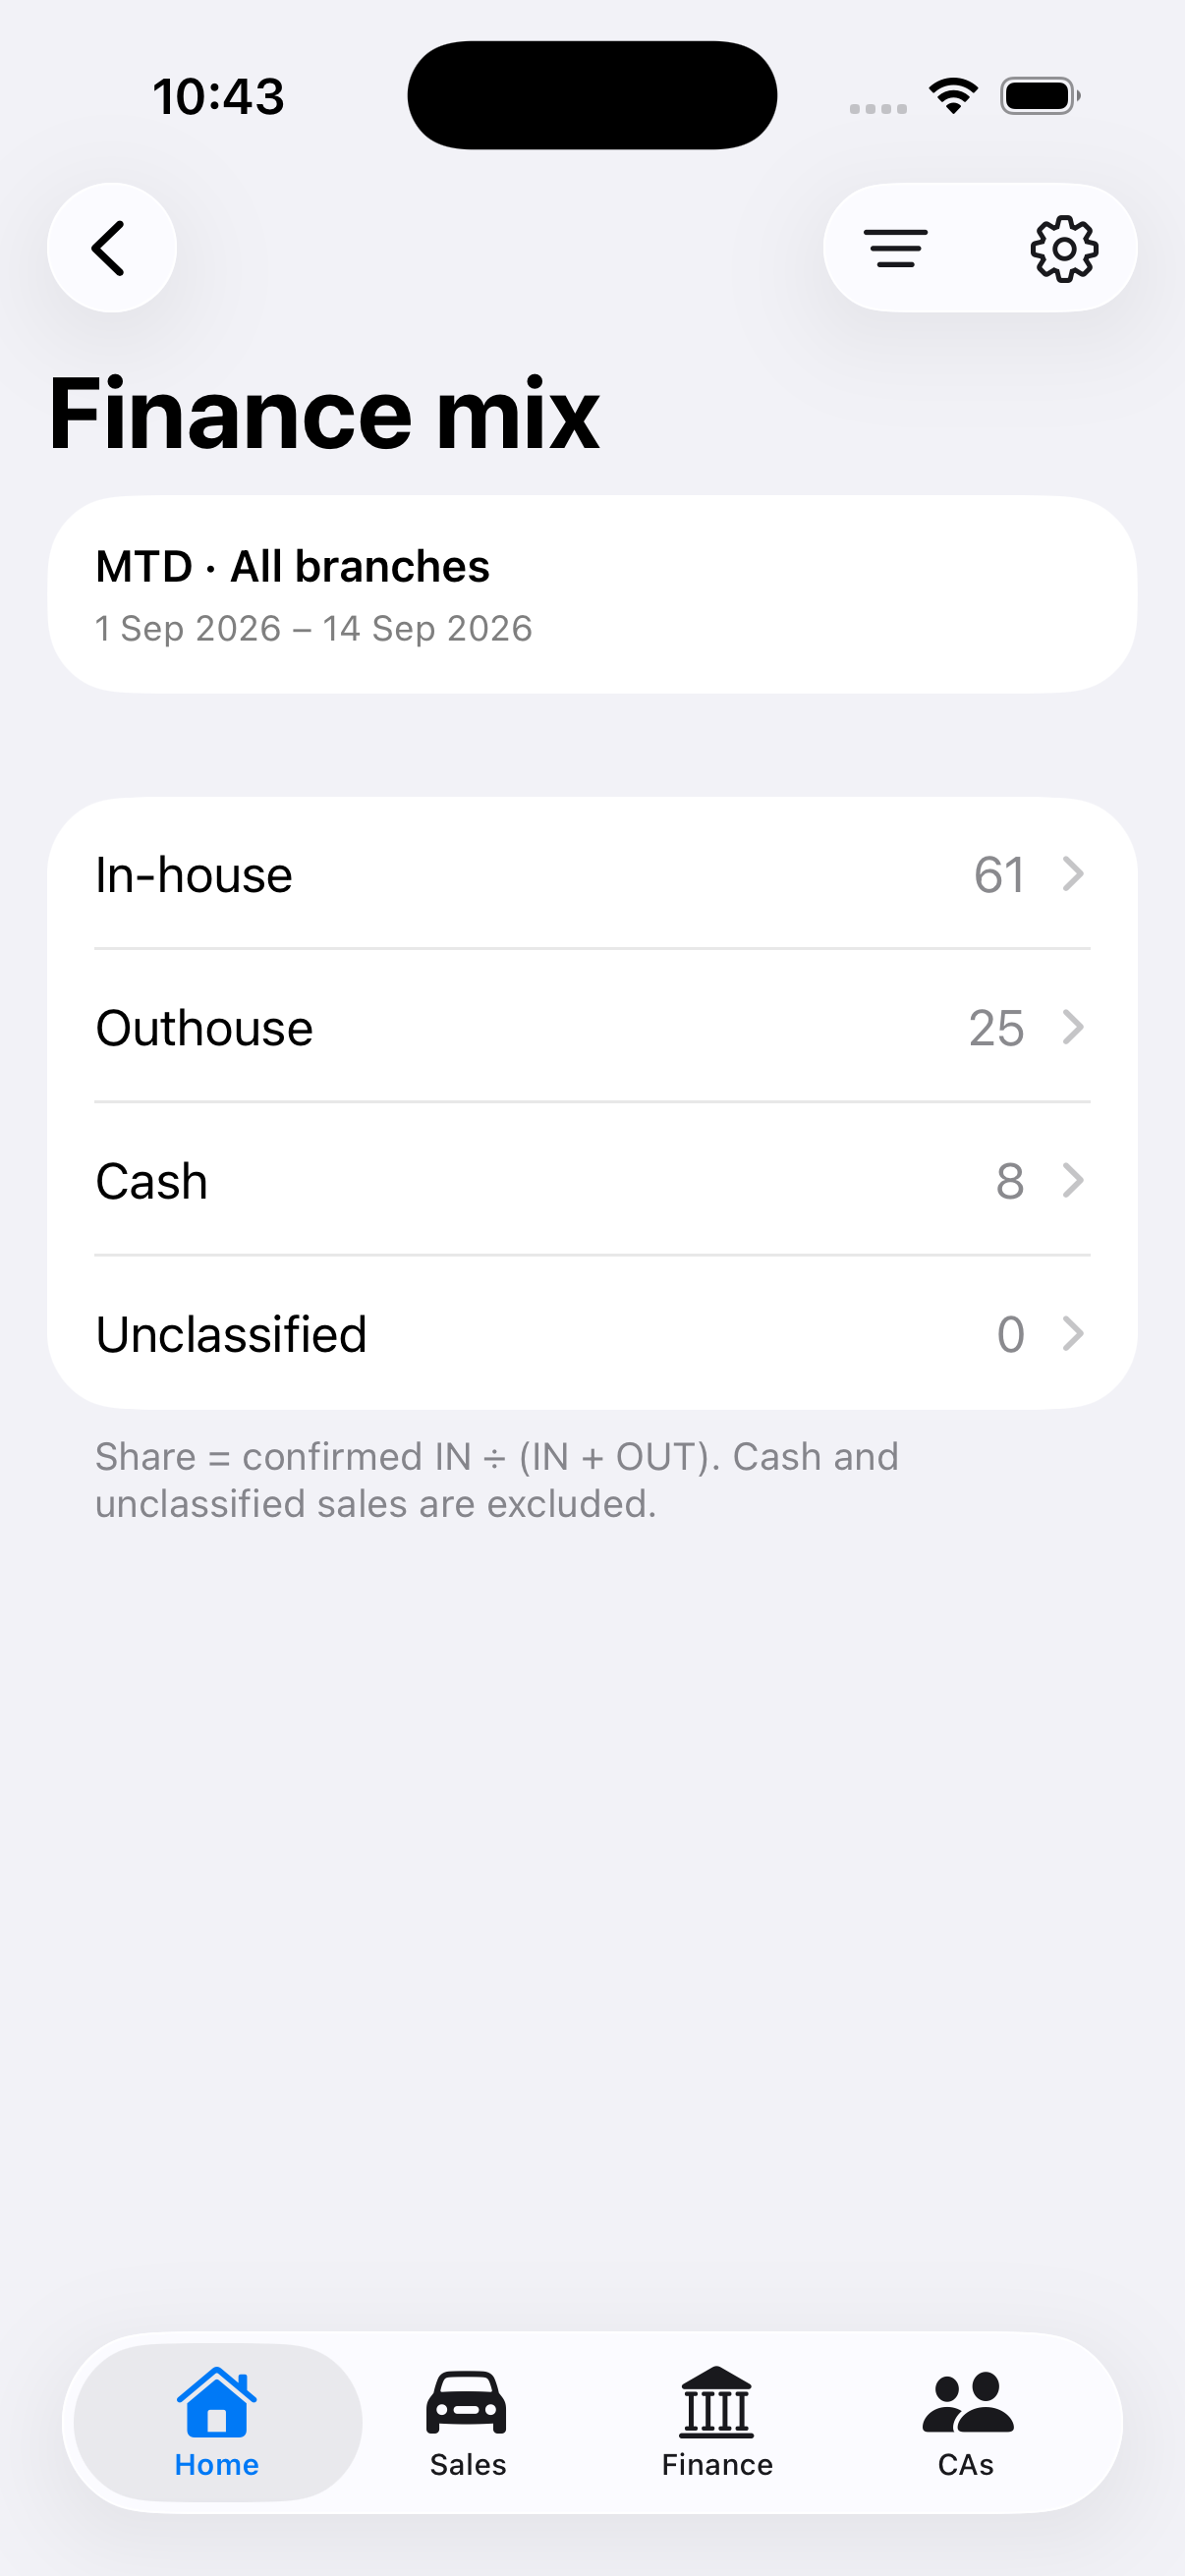
The figures come from a supplied product screenshot. They are an arithmetic example, not an industry target or a claim of customer improvement.
How should cash and unknown records be handled?
Cash vehicles do not belong in the financed-vehicle denominator. Keep them visible in the overall mix. Unknown records should remain a separate category until they are classified; silently treating them as cash or outhouse finance can distort the result.
If there are no financed vehicles, the in-house penetration rate is not available, because the denominator is zero. Reporting 0% would imply there were financed vehicles and none were in-house, which is a different situation.
The finance calculator handles these cases and shows both denominators. It accepts vehicle counts, not currency values.
How do you compare branches fairly?
Use the same period, sales-stage definition, branch attribution, and classification rules. Show the counts beside the percentage. A branch with one in-house vehicle out of one financed vehicle has 100% penetration, but much less evidence than a branch with a larger base.
For a group rate, add the in-house counts across branches and divide by the combined financed count. Do not take an unweighted average of branch percentages unless your intended measure is explicitly an average branch rate.
Does a higher rate mean more commission collected?
Not automatically. Penetration describes finance mix. Expected commission, eligibility, adjustments, and actual receipts are separate measures. A strong mix can coexist with delayed collections. Use the commission reconciliation guide to connect the operational view to follow-up work.
GrepEye DealerPulse brings finance and wider dealership performance into a mobile leadership view. Confirm your definitions and source mappings during setup so every branch reads the same number the same way.